What if you could turn 3D models into a fully interactive experience? Clickable, zoomable, and ready to insert directly into your next online article. XReco partners Capgemini and Deutsche Welle have developed a tool that makes this possible, no coding expertise required. Whether you’re a professional media creator or just starting out, you can use our 3D Infographic Template to take your storytelling to the next level.
Say Goodbye to Flat Graphics – Make Your Articles Interactive with Our 3D Infographic Template
You’re an online storyteller battling weary users and smaller attention spans? Tell your audience they don’t have to travel to the middle of Germany to admire medieval castles from all directions, or patch together a time-traveling DeLorean to marvel at the architecture of Berlin’s former Palace of the Republic. How? 3D Infographics. Easy to create with the XReco template – by yourself, no expert skills needed – and embed in your online article.
There are a couple of interactive 3D models already out there: For instance, the BBC letting you explore IS tunnels and ancient artefacts, NASA showing off their Curiosity Rover, or London’s Science Museum presenting an old typewriter – the last one even has hotspots which are essentially interactive buttons that, when clicked, display additional information. Still, mainstream media arguably underuse the potential of immersive storytelling and 3D objects. It’s a lot of work for many newsrooms and often means collaborating with tech partners, costing time and money. Even when it comes to a concept as seemingly simple as planting 3D objects in online articles. We want to change that.
The XReco 3D Infographic Template
Our partners at Capgemini and Deutsche Welle (DW) developed a 3D Infographic Template using game engine Unity that allows you to annotate your own 3D models, whether they be created with XReco tools or purchased, and add hotspots in the form of images, videos, audio or text. You can then display the 3D model using standard web tech (WebGL) in your online article and allow users to pan, zoom, rotate and interact with it. Basically, it’ll be an HTML output that can be inserted into websites.
To show you how our template works and the kind of results it produces, we’ve turned a total of six objects (and counting!), five of them buildings, into 3D infographics as part of our news media use case:
- Berlin’s former Palace of the Republic
- Potsdam’s Einstein Tower observatory
- Berlin’s Jewish Museum
- The Nebra Ark Visitor Center
- Medieval castle Veste Wachsenburg
- An antique phonograph cylinder
For this, we used XReco’s Structure from Motion tool (SfM) and Gaussian Splatting (GS). They are both technologies that turn 2D material, such as photos and videos, into 3D models but offer different results which in turn affect how the 3D infographics end up looking. The Einstein Tower and Jewish Museum we even made into infographics twice, once as an SfM-model and once as a GS-model, to offer a better comparison of outcomes:
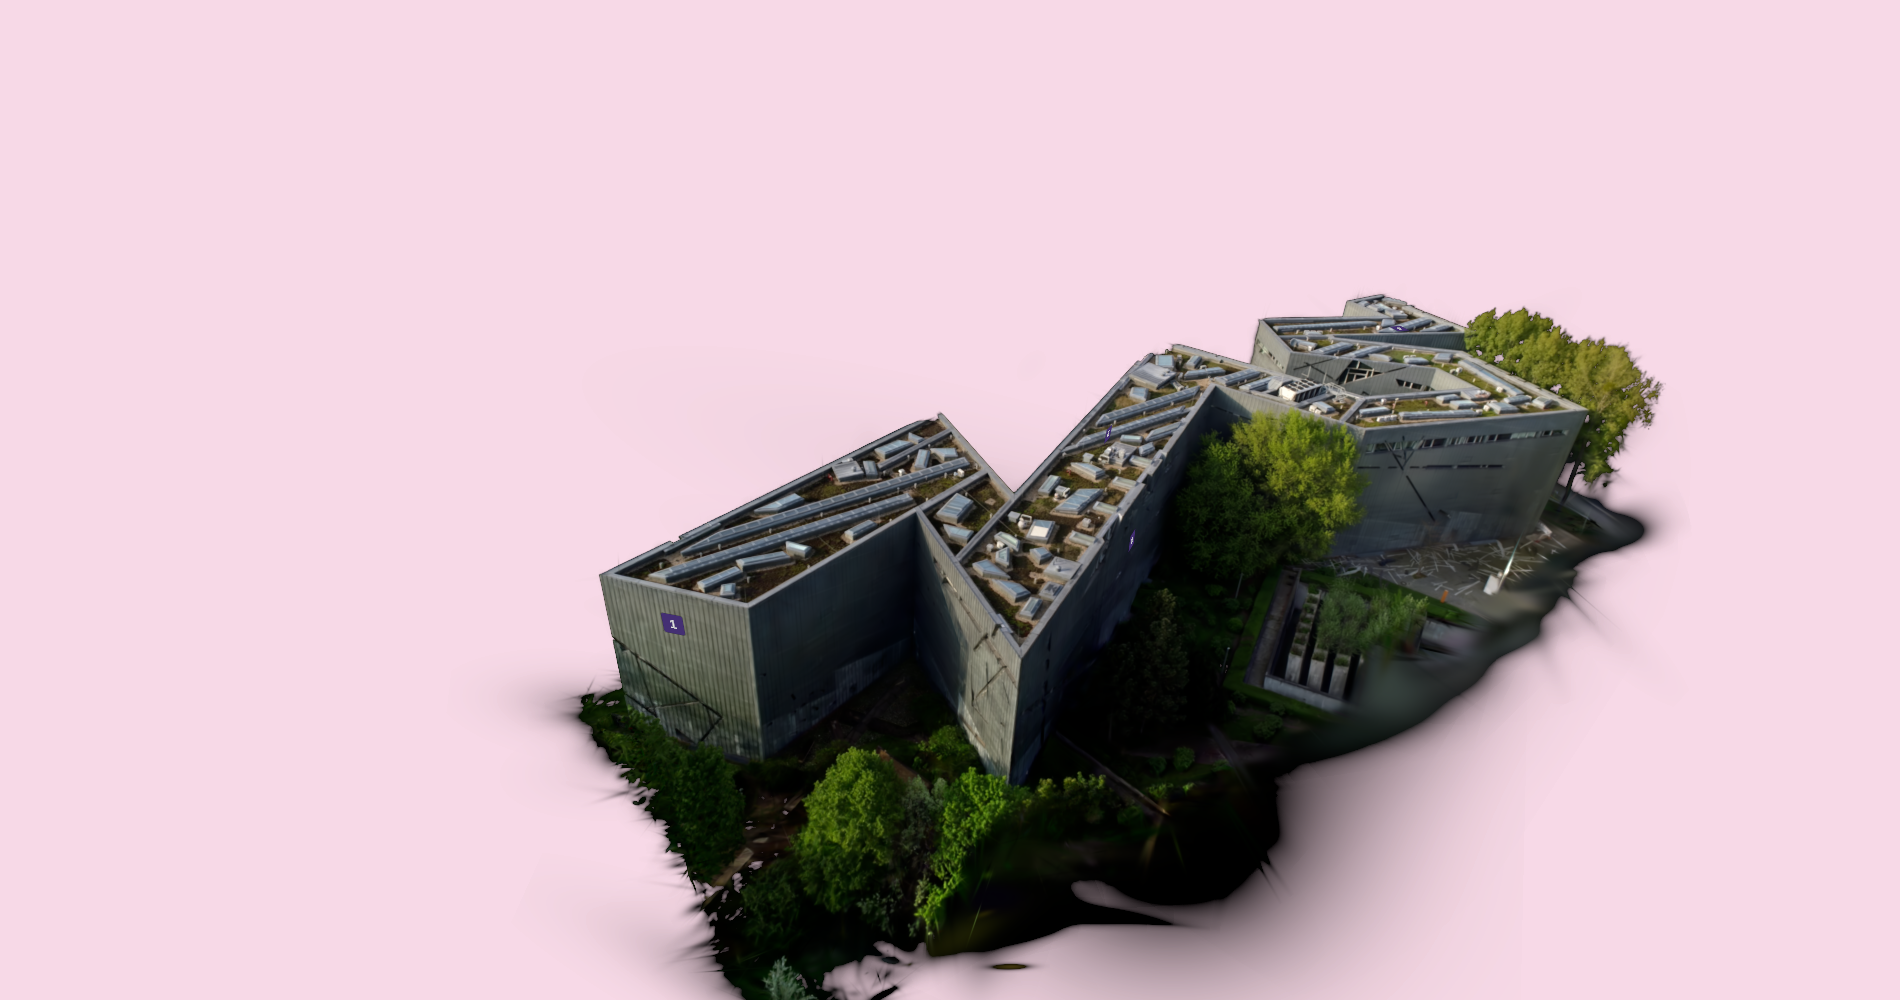
Figure 1: Jewish Museum, Berlin. GS-model.
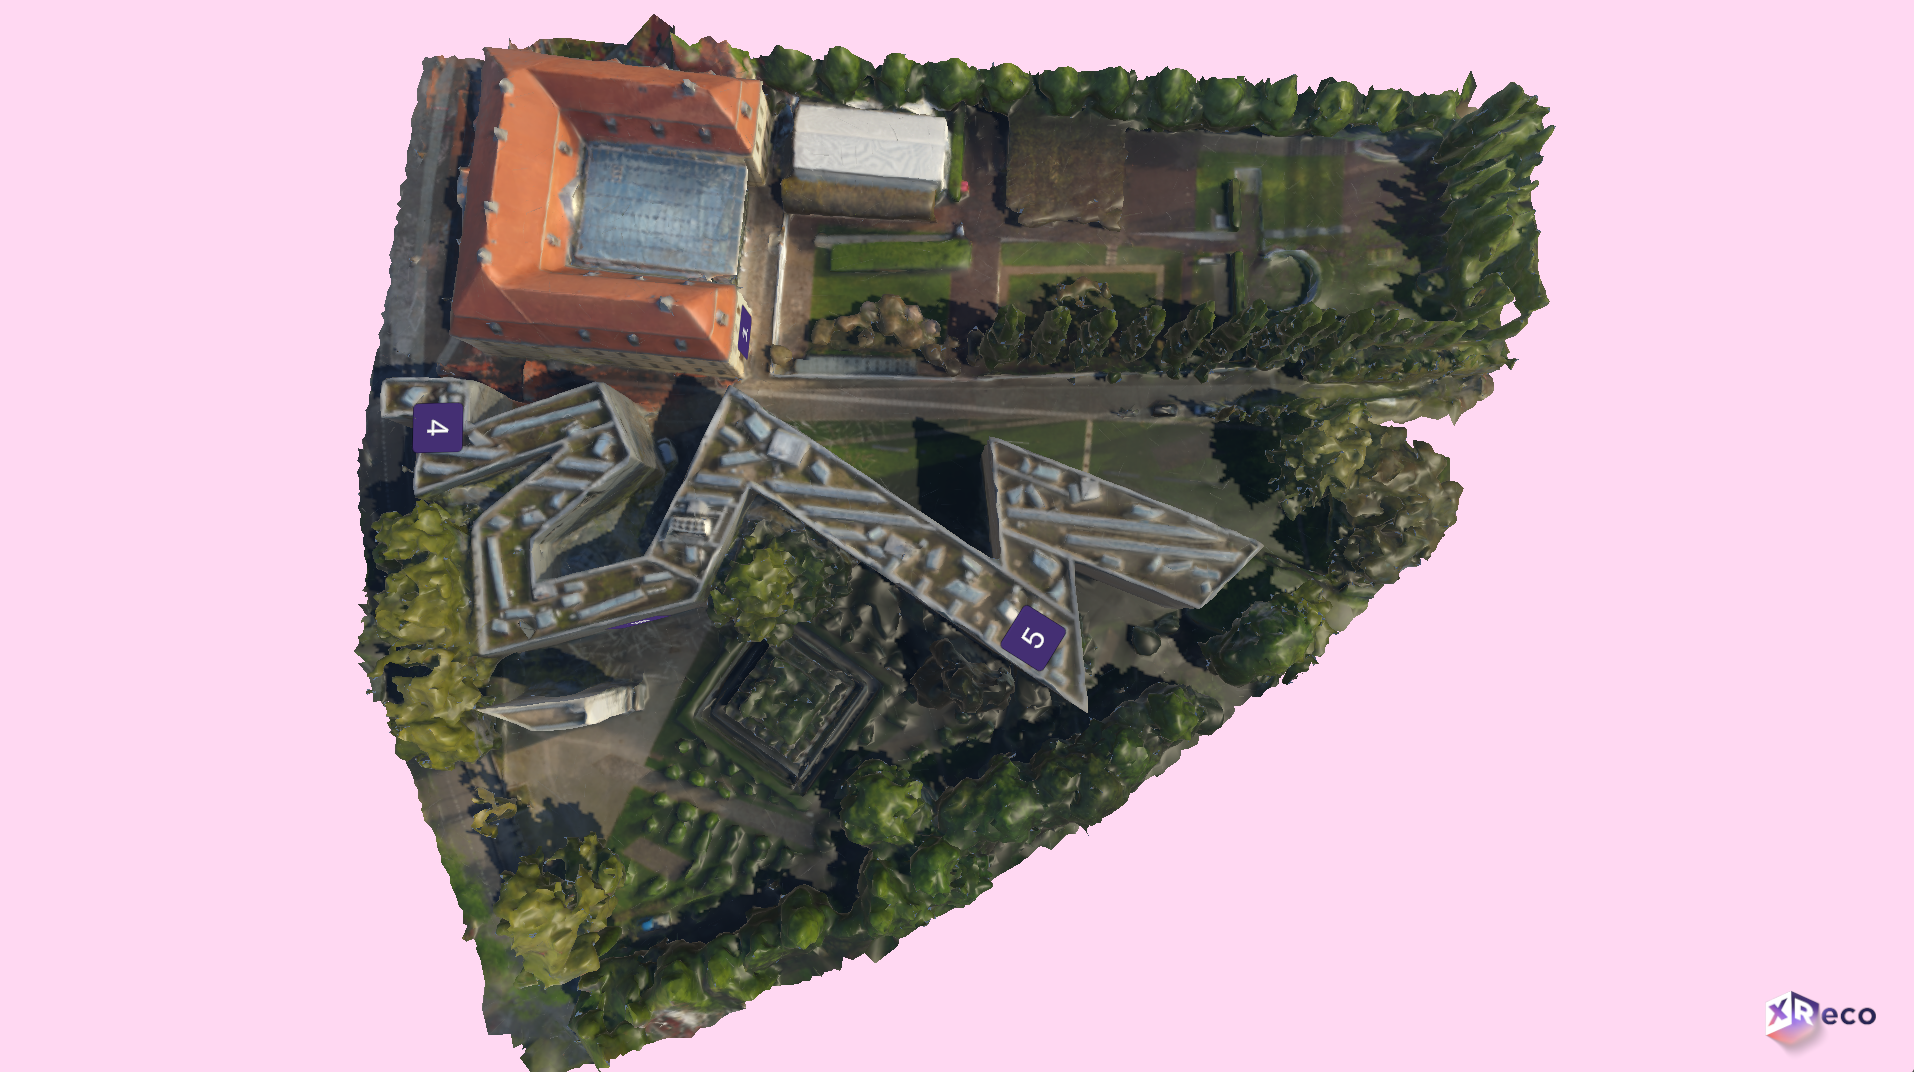
Figure 2: Jewish Museum, Berlin. SfM-model.
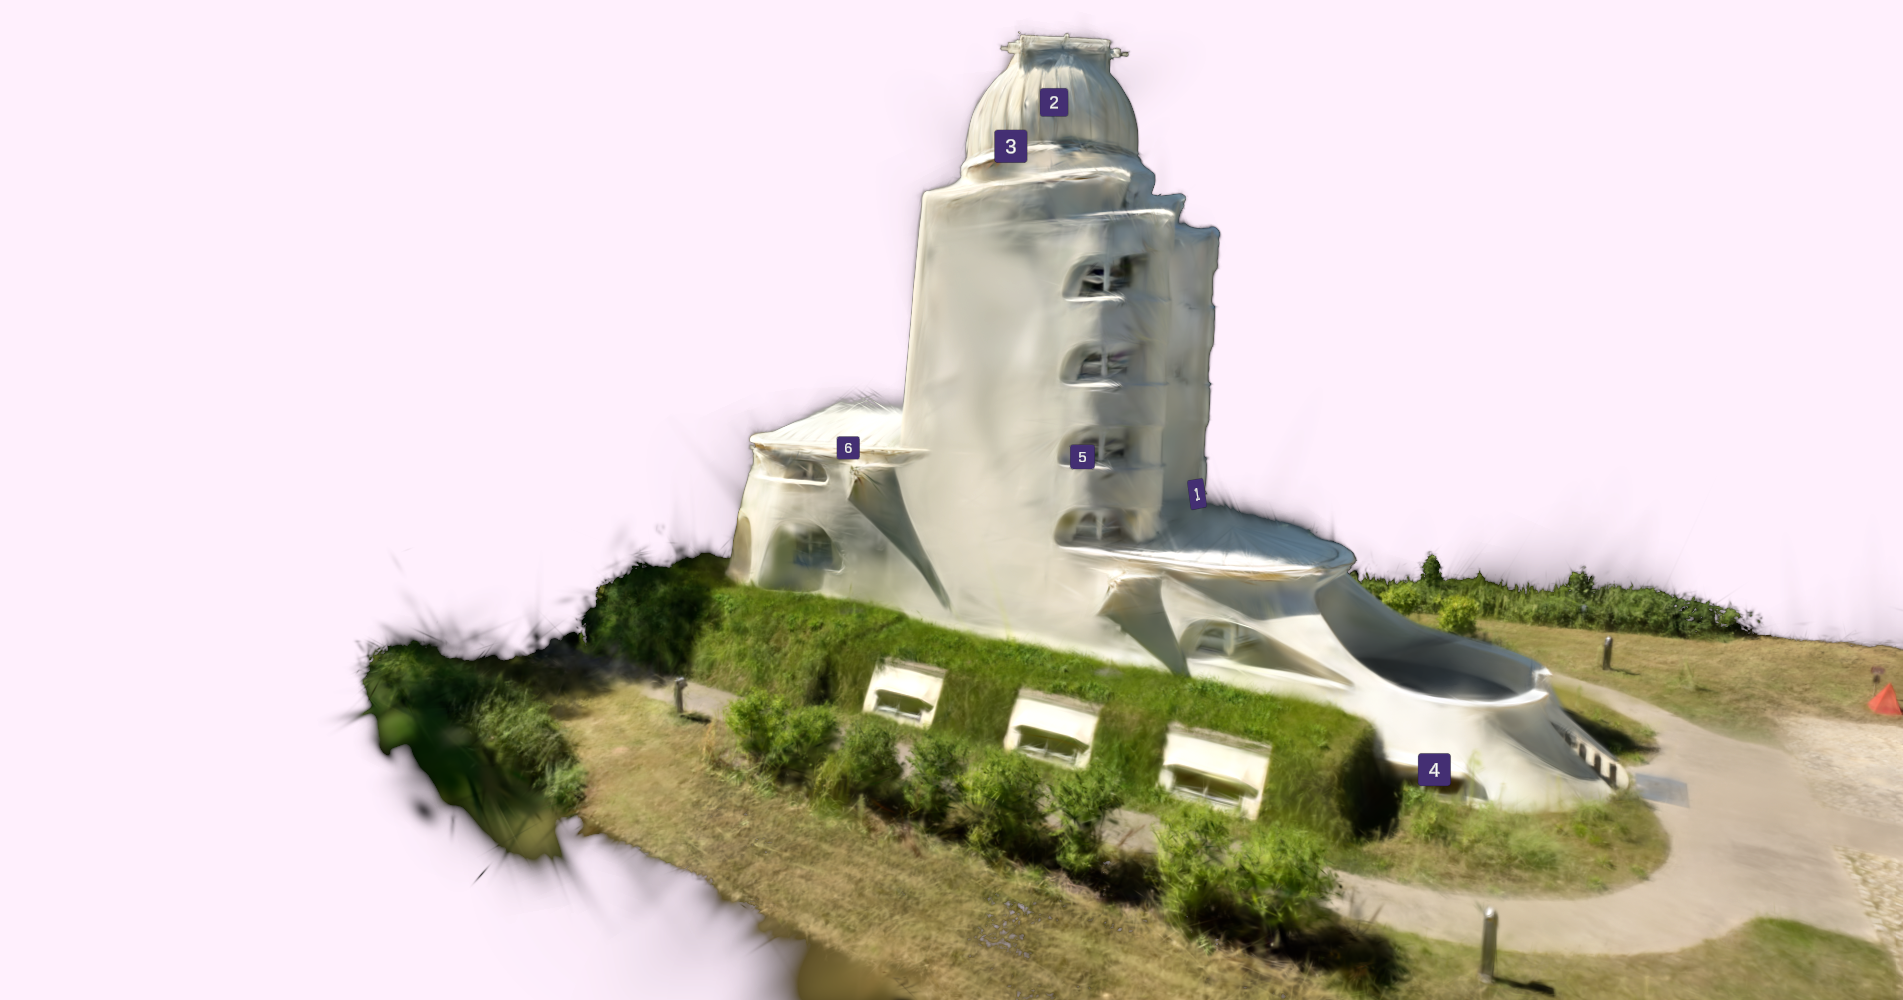
Figure 3: Einstein Tower, Potsdam, Germany. GS-model.
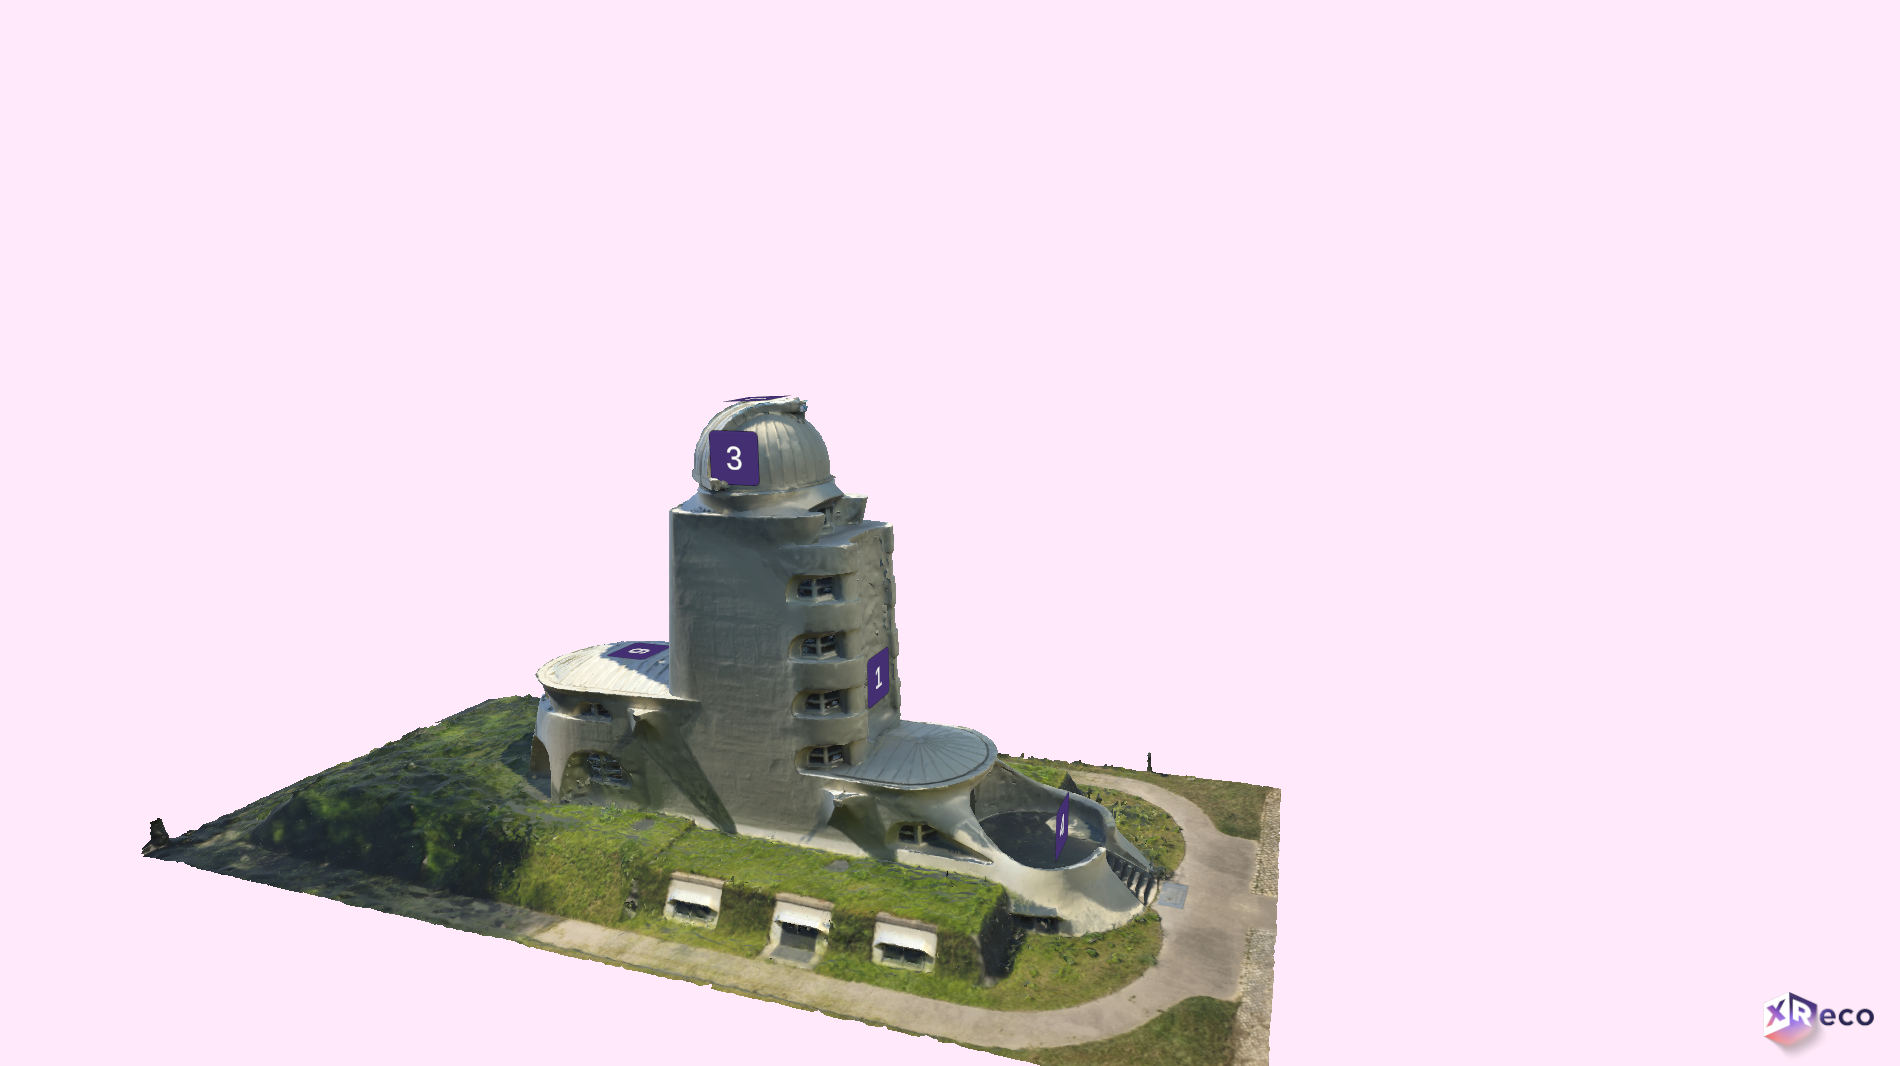
Figure 4: Einstein Tower, Potsdam, Germany. SfM-model.
See the difference? When it comes to creating 3D models, the output is only as good as the input – the results not only depend on the technology but also on the quality (and sometimes quantity) of the 2D footage used. By recreating the Palace of the Republic in 3D (see result below), we demonstrated that XReco tools even work with older videos (from 1991, to be exact), since this is a building that no longer exists. It’s also the reason why the Palace’s 3D model was created with Gaussian Splatting as it offers a more detailed look and is a little closer to real-life photographs and videos of the landmark.
SfM-models have a different look to GS-models – as established – but also capture what an object or building looks like really well. What you end up using depends on your needs and the way you want to tell a story. For instance, GS-models don’t display geometry in the same way that SfM-models do. Meaning that on GS-models, hotspots are constantly visible from all sides and can’t really be hidden by any part of the 3D object – as seen with the Palace of the Republic infographic. SfM-hotspots on the other hand “stick” to a 3D object, can be placed in whatever way you see fit and once you rotate around, say, your 3D castle, you can’t see hotspot Nr.1 from the other side (see the Veste Wachsenburg infographic):
Video 1: Infographic of Berlin’s former Palace of the Republic (GS-model).
Video 2: Infographic of the “Veste Wachsenburg”, a medieval hilltop castle in Holzhausen, Germany (SfM-model).
Another advantage of using an SfM-model as opposed to a GS-model (or: an obj-file instead of a ply-file) is that you can adjust the lighting by playing around with the “light intensity” and “light angle” sliders in our template.
Furthermore, by using our template you can decide whether users can continue to move freely around a 3D object when they open a hotspot, or whether the position of the hotspot should be “fixed”, i.e. navigation in the scene is impossible while the hotspot is selected. In this case, you can choose the position of the camera and at which angle and distance users see the hotspot from:
Video 3: Another excerpt from the infographic of the “Veste Wachsenburg”. Image seen in Boomerang by Andreas Vitting/ picture alliance / imageBROKER.
On the other hand, it makes sense to let viewers roam around the 3D object freely when you let them listen to audio, like music, at the same time, as shown below in the infographic of an old phonograph. That way they can fully immerse themselves in the history of an artefact.
Video 4: Infographic of an old phonograph (SfM-model), an audio recorder for recording and playing back sound (invented in 1877). While the audio icon is selected users can rotate around the 3D object.
If you decide to allow users to rotate around a 3D object while having a hotspot open simultaneously, you’ll find another fork in the road: you can either anchor the hotspot in a certain position (seen in the Nebra Ark infographic below) or let it face the camera, meaning the users, at all times. The latter allows them to always read the text or watch the video displayed – but it will constantly cover part of the 3D building, as demonstrated in the Jewish Museum infographic.
Video 5: Infographic of “Arche Nebra” Visitor Center at the site where the Sky Disc was found, Germany. It’s an SfM-model. Image seen in Boomerang by Andreas Vitting/ picture alliance / imageBROKER.
Video 6: Infographic of the Jewish Museum in Berlin (GS-model).
Again, it comes down to your storytelling needs. The XReco 3D Infographics Template offers enough flexibility for you to try out different scenarios; If, for example, you have a 3D model of a museum and want to show users exactly where a particular object or room is located within the building, it makes sense to fix the hotspot there.
Finally, with our template in Unity you can crop the 3D models to your liking, change the background color of your infographic or the starting position of the camera with simple sliders (i.e. the frame that users see in the very beginning), make the hotspot boxes larger or smaller, and, of course, change text font and color.
Advantages of Displaying 3D Objects in Articles
By using 3D infographics, the narrative structure of your story is enhanced by visual exploration, which provides readers with a window into, for example, real historical architecture. You can make difficult or technical topics, such as anatomy or archeology, more accessible, independent of time or location, and let users view an object from all angles. That way they can experience spatial dimensions that would be hard to convey with just text. Turning readers into participants, it might be easier to keep their curiosity about your topic, too. Plus, with our Infographic Templates, the 3D viewer can be embedded right in the article, no redirects or downloads necessary. And, if you so wish, you can reuse them for VR and AR projects.
Video 7: This video demonstrates how to use our ‘3D Infographic Template’ to make your online articles more engaging. Notable sources from the video below.
So, whether you’re a seasoned media professional or just starting out as a content creator, XReco’s 3D Infographic Templates can help your online article reach a new level of interactivity.
About The Author
Olivia Stracke works at ‘DW Innovation’, the broadcaster’s R&D department. She wrote her Master’s thesis in Cultural Anthropology on immersive journalism and worked for years as a freelance journalist. At XReco, she is part of the News Media Demonstrator team.
Share this article!
Notable sources from the video:
Nebra Ark:
Hotspot #2, Text (Timecode: 1:46-01:50):
- Die Himmelscheibe von Nebra. URL: https://www.himmelsscheibe-erleben.de/arche-nebra/himmelsscheibe-von-nebra (seen 26/08/25).
- Landesmuseum für Vorgeschichte. URL: https://www.landesmuseum-vorgeschichte.de/himmelsscheibe-von-nebra (seen 26/08/25).
Hotspot #3, Text (Timecode: 00:17-00:19):
- Die Himmelscheibe von Nebra, Fundgeschichte. URL: https://www.himmelsscheibe-erleben.de/arche-digital/himmelsscheibe-von-nebra/fundgeschichte (seen 26/08/25).
- Die Himmelscheibe von Nebra, wikipedia. URL: https://de.wikipedia.org/wiki/Himmelsscheibe_von_Nebra (seen 26/08/25).
Einstein Tower:
Hotspot #1, Image (Timecode: 00:30-00:32):
- „File: Sterrenwachten, obversatorium, (…)“, wikimedia commons. URL: https://commons.wikimedia.org/wiki/File:Sterrenwachten,_obversatorium,_SFA022815730.jpg (seen 26/08/25).
Hotspot #4, Image (Timecode: 01:18-01:20):
- „Potsdam, Einsteinturm”, Europeana. URL: https://www.europeana.eu/en/item/2064108/Museu_ProvidedCHO_Kunstbibliothek__Staatliche_Museen_zu_Berlin_DE_MUS_018313_1693463 (seen 26/08/25). Drawing by Erich Mendelsohn (1887 – 1953). This item is provided and maintained by Staatliche Museen zu Berlin, Kunstbibliothek. License: https://creativecommons.org/licenses/by-nc-sa/3.0/, no changes were made.
Hotspot #4, Text (Timecode: 01:18-01:20):
- „100 Jahre Einsteinturm (…)“, AIP. URL: https://www.aip.de/de/institute/locations/einstein-tower/100-years-einstein-tower/ (seen 26/08/25).
- “Einsteinturm”, AIP. URL: https://www.aip.de/de/institute/locations/einstein-tower/ (seen 26/08/25).
Phonograph:
Hotspot #2, Image (Timecode: 00:32-00:35):
- „File: Edison wasrollen (…)”, wikimedia commons. URL: https://commons.wikimedia.org/wiki/File:Edison_wasrollen_Or._27.131.jpg (seen 26/08/25). By Snouck Hurgronje, C. (Christiaan) (1857-1936). License: https://creativecommons.org/licenses/by/4.0/deed.en, no changes were made.
Hotspot #2, Text (Timecode: 00:32-00:35):
- “Phonograph cylinder”, wikipedia. URL: https://en.wikipedia.org/wiki/Phonograph_cylinder (seen 26/08/25).
Hotspot #3, Audio and Text (Timecode: 00:51-01:03):
- “File: Edison cylinder Lost Chord.ogg”, wikimedia commons. URL: https://commons.wikimedia.org/wiki/File:Edison_cylinder_Lost_Chord.ogg (seen 26/08/2025).
Palace of the Republic:
Hotspot #1, Text (Timecode: 00:36-00:39):
- “Hin und weg. Der Palast der Republik ist Gegenwart“, Museumsportal Berlin. URL: https://www.museumsportal-berlin.de/de/ausstellungen/hin-und-weg-der-palast-der-republik-ist-gegenwart/ (seen 26/08/25).
- Palast der Republik, wikipedia. URL: https://de.wikipedia.org/wiki/Palast_der_Republik (seen 26/08/25).
Jewish Museum, Berlin:
Hotspot #1, Image (Timecode: 01:40-01:44): By Sean Gallup/Getty Images.
Hotspot #1, Text (Timecode: 01:40-01:44):
- “Jüdisches Museum Berlin”, wikipedia. URL: https://de.wikipedia.org/wiki/J%C3%BCdisches_Museum_Berlin (seen 26/08/25).
- “Der Barocke Altbau”, Jüdisches Museum Berlin. URL: https://www.jmberlin.de/der-barocke-altbau (seen 26/08/25).
Hotspot #3, Image (Timecode: 01:25-01:27): By Britta Pedersen/picture alliance/dpa-Zentralbild.
Hotspot #4, Image (Timecode: 01:28-01:30):
- „Jewish Museum Berlin“, wikimedia commons. URL: https://commons.wikimedia.org/w/index.php?search=J%C3%BCdisches+Museum+Berlin&title=Special%3ASearch&ns0=1&ns6=1&ns12=1&ns14=1&ns100=1&ns106=1#/media/File:Berlin-Juedisches_Museum-23-Treppe-2017-gje.jpg (seen 26/08/25). By Gerd Eichmann. License: https://creativecommons.org/licenses/by/4.0/, no changes were made.
Veste Wachsenburg
Hotspot #1, Image (Timecode: 01:32-01:36): By hwo/ picture alliance / imageBROKER.
Hotspot #1, Text (Timecode: 01:32-01:36):
- “Veste Wachsenburg”, wikipedia. URL: https://de.wikipedia.org/wiki/Veste_Wachsenburg (seen 26/07/25).
- „Drei Gleichen“, wikipedia. URL: https://de.wikipedia.org/wiki/Drei_Gleichen#cite_note-Meynen-1 (seen 26/07/25).


Follow XReco!